So you’ve built your website and you’ve got some visitors. Do you know where they came from? What they were looking for? Which bits of your site produced the most sales? Which bits of your site turned people off and sent them scurrying off elsewhere?
Well you need to…
This information will help you to get more traffic and increase your conversions — whether that means sales or more enquiries, or more signups — whatever your desired outcome is, you presumably want more of it.
What is Google Analytics?
Google Analytics is a service that allows you analyse your web site and traffic with the goal of increasing it’s effectiveness for you. And it’s free, at least in it’s standard form which is what everybody uses (the premium version is $150,000 per year!).
How to get started with Google Analytics
Just go along to www.google.com/analytics and signup for a free account. If you don’t have a Google account (surely you must have a Google account...) you’ll be prompted to create one, otherwise just login with your Google Account and click ‘Sign Up’.
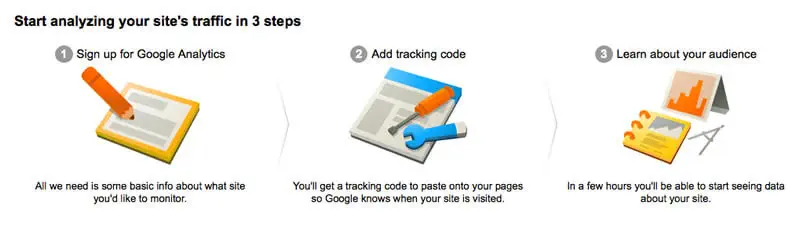
You’ll be asked a few simple questions about your account and your website or property as they call it (you can analyse several websites in one account). I recommend you choose “Universal Analytics’ rather than the older ‘Classic Analytics’ as you’ll only have to change it later if you go with Classic.
When you’ve finished the questions, just click the blue ‘Get Tracking ID’ button at the bottom.
All you have to do is to insert that code into every page on your website that you want to track. Depending upon how your website is built, there may be an easier way than pasting it into every page. Some sites may have a common include file that is included in every page and you can paste it in there. Other sites built with templates or WordPress may have a ready-made tool for adding Analytics code — it’s a pretty standard requirement.
In a few hours, if you go to the ‘Reporting’ tab at the top of the screen you should start seeing some data about your site.
What can you measure with Google Analytics?
The menu in the left-hand sidebar is divided into four main sections.
Audience
This section tells you about who is visiting your site. Audience reports give insight into:
- The demographics of your audience – Audience > Demographics.
- Your mix of new and return users and how engaged they are – Audience > Behavior.
- The browsers and networks they use – Audience > Technology.
- Which mobile devices they are using – Audience > Mobile.
Acquisition
This section tells you about how you got the visitors — organic (search engine optimisation), direct traffic, AdWords and other advertising mediums, and Social Networks such as Facebook and Twitter. As well as seeing how many visitors came from each source, you can also see metrics such as Bounce Rate, Pages/Visit, and Average Visit Duration across each of these sources so you can see which sources of traffic work best for you.
Behaviour
Shows you what your visitors did on your site — which page they entered the site on (landing page) and at what point they left the site (exit page). You can see what they searched for on your site which is a great source of ideas for new content so you can give your visitors what they are actually looking for.
Conversions
The payoff. You can setup whatever actions you want to measure as conversions — from placing an order, to downloading a PDF, to viewing a certain page or signing up for an email list. You can then analyse these conversions across all the previous dimensions so you can see what type of traffic and what pages and content convert the best for you.
In addition to these metrics, Google Analytics also has an Ecommerce section that can track individual sales for Ecommerce sites.
If you use Google AdWords, you can link Analytics so that you can see AdWords cost data in Analytics, and also see conversion data in AdWords.
See site visitors (and what they’re doing) in Real Time
I have to confess this is an endless source of fascination for me — you can also see visitors on your site in Real Time. You can see them arrive, where they came from, what page they are on and you can see conversions as they happen.
You can’t identify them as individuals (unfortunately), or interact with them but it can often be useful to see things as they actually happen, particularly if you are running a big promotional campaign or something and you want to make sure it’s working as it should. Very useful for spotting errors quickly.
Improve the profitability of your advertising
Somebody famous (I forget who) once said ‘Half the money you spend on advertising is wasted. The trouble is you never know which half…’
Analytics will link with AdWords so you can track which campaigns, adverts and keywords brought visitors to your site and you can see what they did when they got there. How engaged they were, which pages they visited and crucially how well they converted. Conversions can feed back into AdWords so that against each Campaign, AdGroup, Advert and Keyword you can see the number of conversions and the conversion rate. Which adverts work best for you — which make you money and which lose you money?
If you’re a publisher, and you display AdSense adverts on your site, it will also link with AdSense to show where your ad revenue is coming from.
So how do you use all this data?
Information is great but unless you do something differently as a result, it is worthless. Analytics is capable of providing so much information (and trust me I’ve only covered a tiny percentage of what it can do), that there is a real danger of drowning in data. You can easily be overwhelmed by the sheer volume of information that Analytics thrusts at you and become hopelessly confused, unable to take any action, as a result of ‘analysis paralysis’. There is so much information that you don’t know where to start and end up doing nothing, thereby negating all the benefits (and wasting a good few hours into the bargain).
So here is a starting point for you. You might need to tweak this slightly to suit your particular needs/business but here is a way to get started in Analytics without getting buried in it.
1 – Setup your conversions
Whatever your goals are — email signups, orders, page views, downloads — set them up in Analytics so you can start measuring them. Especially if you use AdWords to advertise your site this will transform your life. You can now see what pays and what doesn’t and alter your advertising accordingly. If you do nothing else with Analytics other than setup conversion tracking and import it into AdWords you will have made a massive improvement to your business.
2 – See where your visitors come from
This is perhaps the first thing you want to know — where do my visitors come from? Is it paid search, organic traffic, links from other sites, direct typing in your URL (maybe from direct mail or offline adertising), Facebook or other social media? As you can track the engagement and conversion rate of each of these traffic segments you can see which traffic sources work best for you. You can then look at developing your most effective traffic sources further and you know not to waste time on sources that are not effective for you.
3 – Understand what your visitors want
You can see the keyword (or search term) that led them to your site, whether it was from paid advertising or organic search engine results. This tells you what they are looking for — did you provide it? Can you provide more of it? Let your customers tell you what they want and then give them it. You can use this not only to improve what you are currently doing, but also for finding and developing new opportunities. Lets say you have a site about fishing equipment and you see that a significant portion of your visitors were actually searching for ‘fishing clothing’. Do you have a section on fishing clothing? If not can you create one? You know your visitors are actively looking for it so there is an opportunity there.
4 – Check your site works properly for all visitors
You can see in the Audience section which browsers/systems your visitors use. Does your site work properly in all those browsers? If not you may be losing people. Does your site give a good experience on mobile (smartphones, tablets)? You can see what proportion of your site traffic is on mobile devices and therefore how important this is for you (although it’s a pretty safe bet that even if it’s not important now, it will be pretty soon).
5 – Look for trends
What is going up, what’s going down? Your initial data may not be that useful as you’ve nothing to compare it with but over time a picture emerges. If your traffic suddenly drops 30% you can now see why — was it overall or did one particular segment drop? Did something suddenly stop working? Conversely if your conversion rate suddenly shoots up you can now see why and maybe change something to take advantage of it.
Conclusion
Google Analytics provides some very useful (and FREE!) tools to help you improve the performance of your website and online marketing. It provides a wealth of data but remember it’s only useful if you are able to take action and change things as a result of it. Don’t just analyse for the sake of it, use the information to understand your visitors better but look for actionable information that you can use to make improvements.